How to read the Praemostro graph
Praemostro has developed an advanced forecasting system that helps emergency department staff plan resources and staffing based on expected patient inflow. But how do you read the graph correctly, and how can the information be used to make better decisions? This article guides you through the structure of the graph and how it can be used.
How to read the Praemostro graph
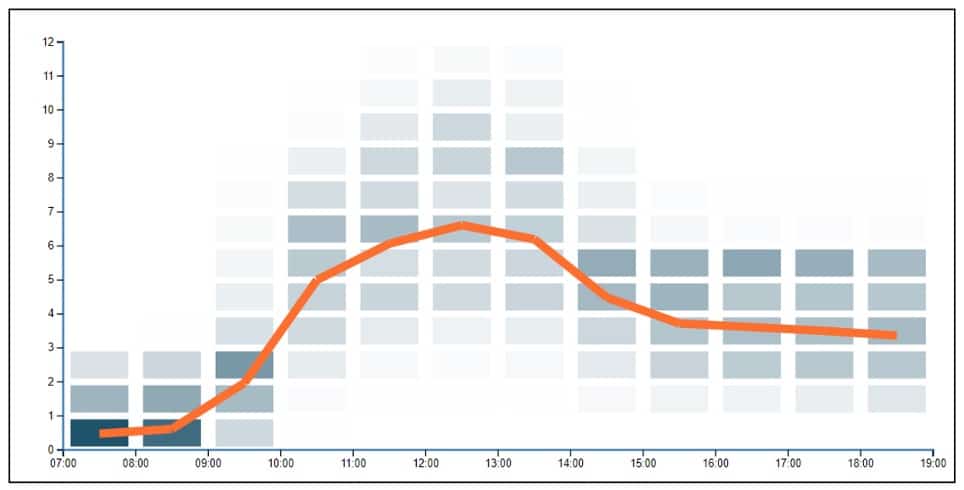
The graph is fundamentally built as a coordinate system with two axes: the Y-axis (the vertical axis) shows the expected number of patients arriving in a given hour, while the X-axis (the horizontal axis) represents the timeline for the next 12 hours from the moment the graph is read.
Two additional elements are key to understanding the graph. The orange line shows the expected number of patients per hour, for example, 0–1 patients between 7:00 and 8:00 and 6–7 patients between 12:00 and 13:00. The blue boxes, on the other hand, illustrate the confidence level of the predictions. The darker and more concentrated the blue box is around the orange line, the more reliable the prediction. Many scattered blue boxes along the Y-axis thus indicate higher uncertainty.
To interpret the graph correctly, you need to assess the interplay between the orange line and the blue boxes. When a dark blue box is close to the orange line, the prediction is very reliable. Conversely, a light blue box or many scattered boxes indicate greater uncertainty regarding patient inflow.

Praemostro’s graph can primarily be used to gain insight and an overview of three typical situations in an emergency department:
1. For one, the graph helps assess the need for adjusting staffing during busy periods. Short-term busyness lasting a couple of hours can often be managed with existing resources, whereas prolonged busyness or very high activity may require extra staff to be called in.
2. Second, the graph can be used to manage sick leave. During periods of low expected activity with high prediction reliability, you may avoid finding a replacement, while busy periods will require increased staffing.
3. Finally, the graph is highly useful as a tool to support staff well-being. If staff know what level of busyness to expect in the coming hours or for the shift as a whole, they feel much more in control of the day’s practical flow. This makes it easier to decide, for example, how busy they need to be with individual patients, when they can eat, and when they should prepare for a wave of busyness.
In short, Praemostro’s graph is an effective tool for planning in a busy workday. By understanding the interplay between the orange line and the blue boxes, staff can make well-informed decisions, ensure better resource distribution, and create a better working environment for themselves. The system is designed to provide an overview and support staff in handling both the routine and more acute challenges of the day.